


Why One Night's Numbers Can Mislead You
It is common to see an AHI of 1.2 on Monday and 4.8 on Wednesday, with nothing obviously different. That swing can feel alarming, but nightly CPAP data is naturally noisy.
AHI is a rate: events divided by hours of therapy. Short or fragmented nights make that rate unstable. A few extra events in a 3-hour night move the number far more than the same events in an 8-hour night. For example, 6 events over 3 hours is an AHI of 2.0, while 6 events over 8 hours is 0.75.
Sleep itself is also uneven. Breathing events cluster in certain conditions, especially REM sleep and back sleeping, so a night with more of either can score higher without any change in your underlying condition.
The takeaway is that a single night is a data point, not a verdict. Therapy is judged by what happens across weeks, which is why sleep medicine reviews usage and efficacy over time rather than reacting to one reading.
Common Reasons Your Numbers Swing
Most night-to-night differences trace back to a short list of everyday factors:
- Sleep position: more time on your back often means more obstructive events.
- REM sleep amount: muscle tone drops in REM, so airway collapse is more likely. Late-night REM-heavy stretches can raise events.
- Alcohol or sedatives: these can relax airway muscles and worsen breathing events, particularly early in the night.
- Nasal congestion or allergies: a blocked nose can increase mouth breathing and leak.
- Mask fit and leak: a shifted mask can cause large leaks that disrupt both sleep and the machine's event detection.
- Total usage time: very short nights inflate or distort AHI.
- Illness, stress, or poor sleep the night before: these can change how deeply and how continuously you sleep.
Not all variation is physiological. Machines also estimate events from airflow, so noisy signals from leaks or mouth breathing can shift how events are classified. Checking leak alongside AHI helps you tell whether a high night reflects breathing or simply a poor seal.
Use Averages and Spread, Not Single Points
A more reliable way to read your data is to zoom out. Instead of asking "what was last night's AHI?", ask "what has my AHI looked like over the past 2–4 weeks?"
Two simple measures help:
- Median: the middle value across your nights. It is less affected by one terrible night than the average is.
- Spread: how far your good and bad nights are from each other. A tight range around 1–2 tells a different story from a range swinging between 0.5 and 9.
A useful habit is to compare 7-day and 30-day views. If the 7-day average is sitting inside the normal range of your 30-day history, a single high night is probably just noise. If the 7-day view has moved clearly away from your baseline and stayed there, that is worth a closer look.
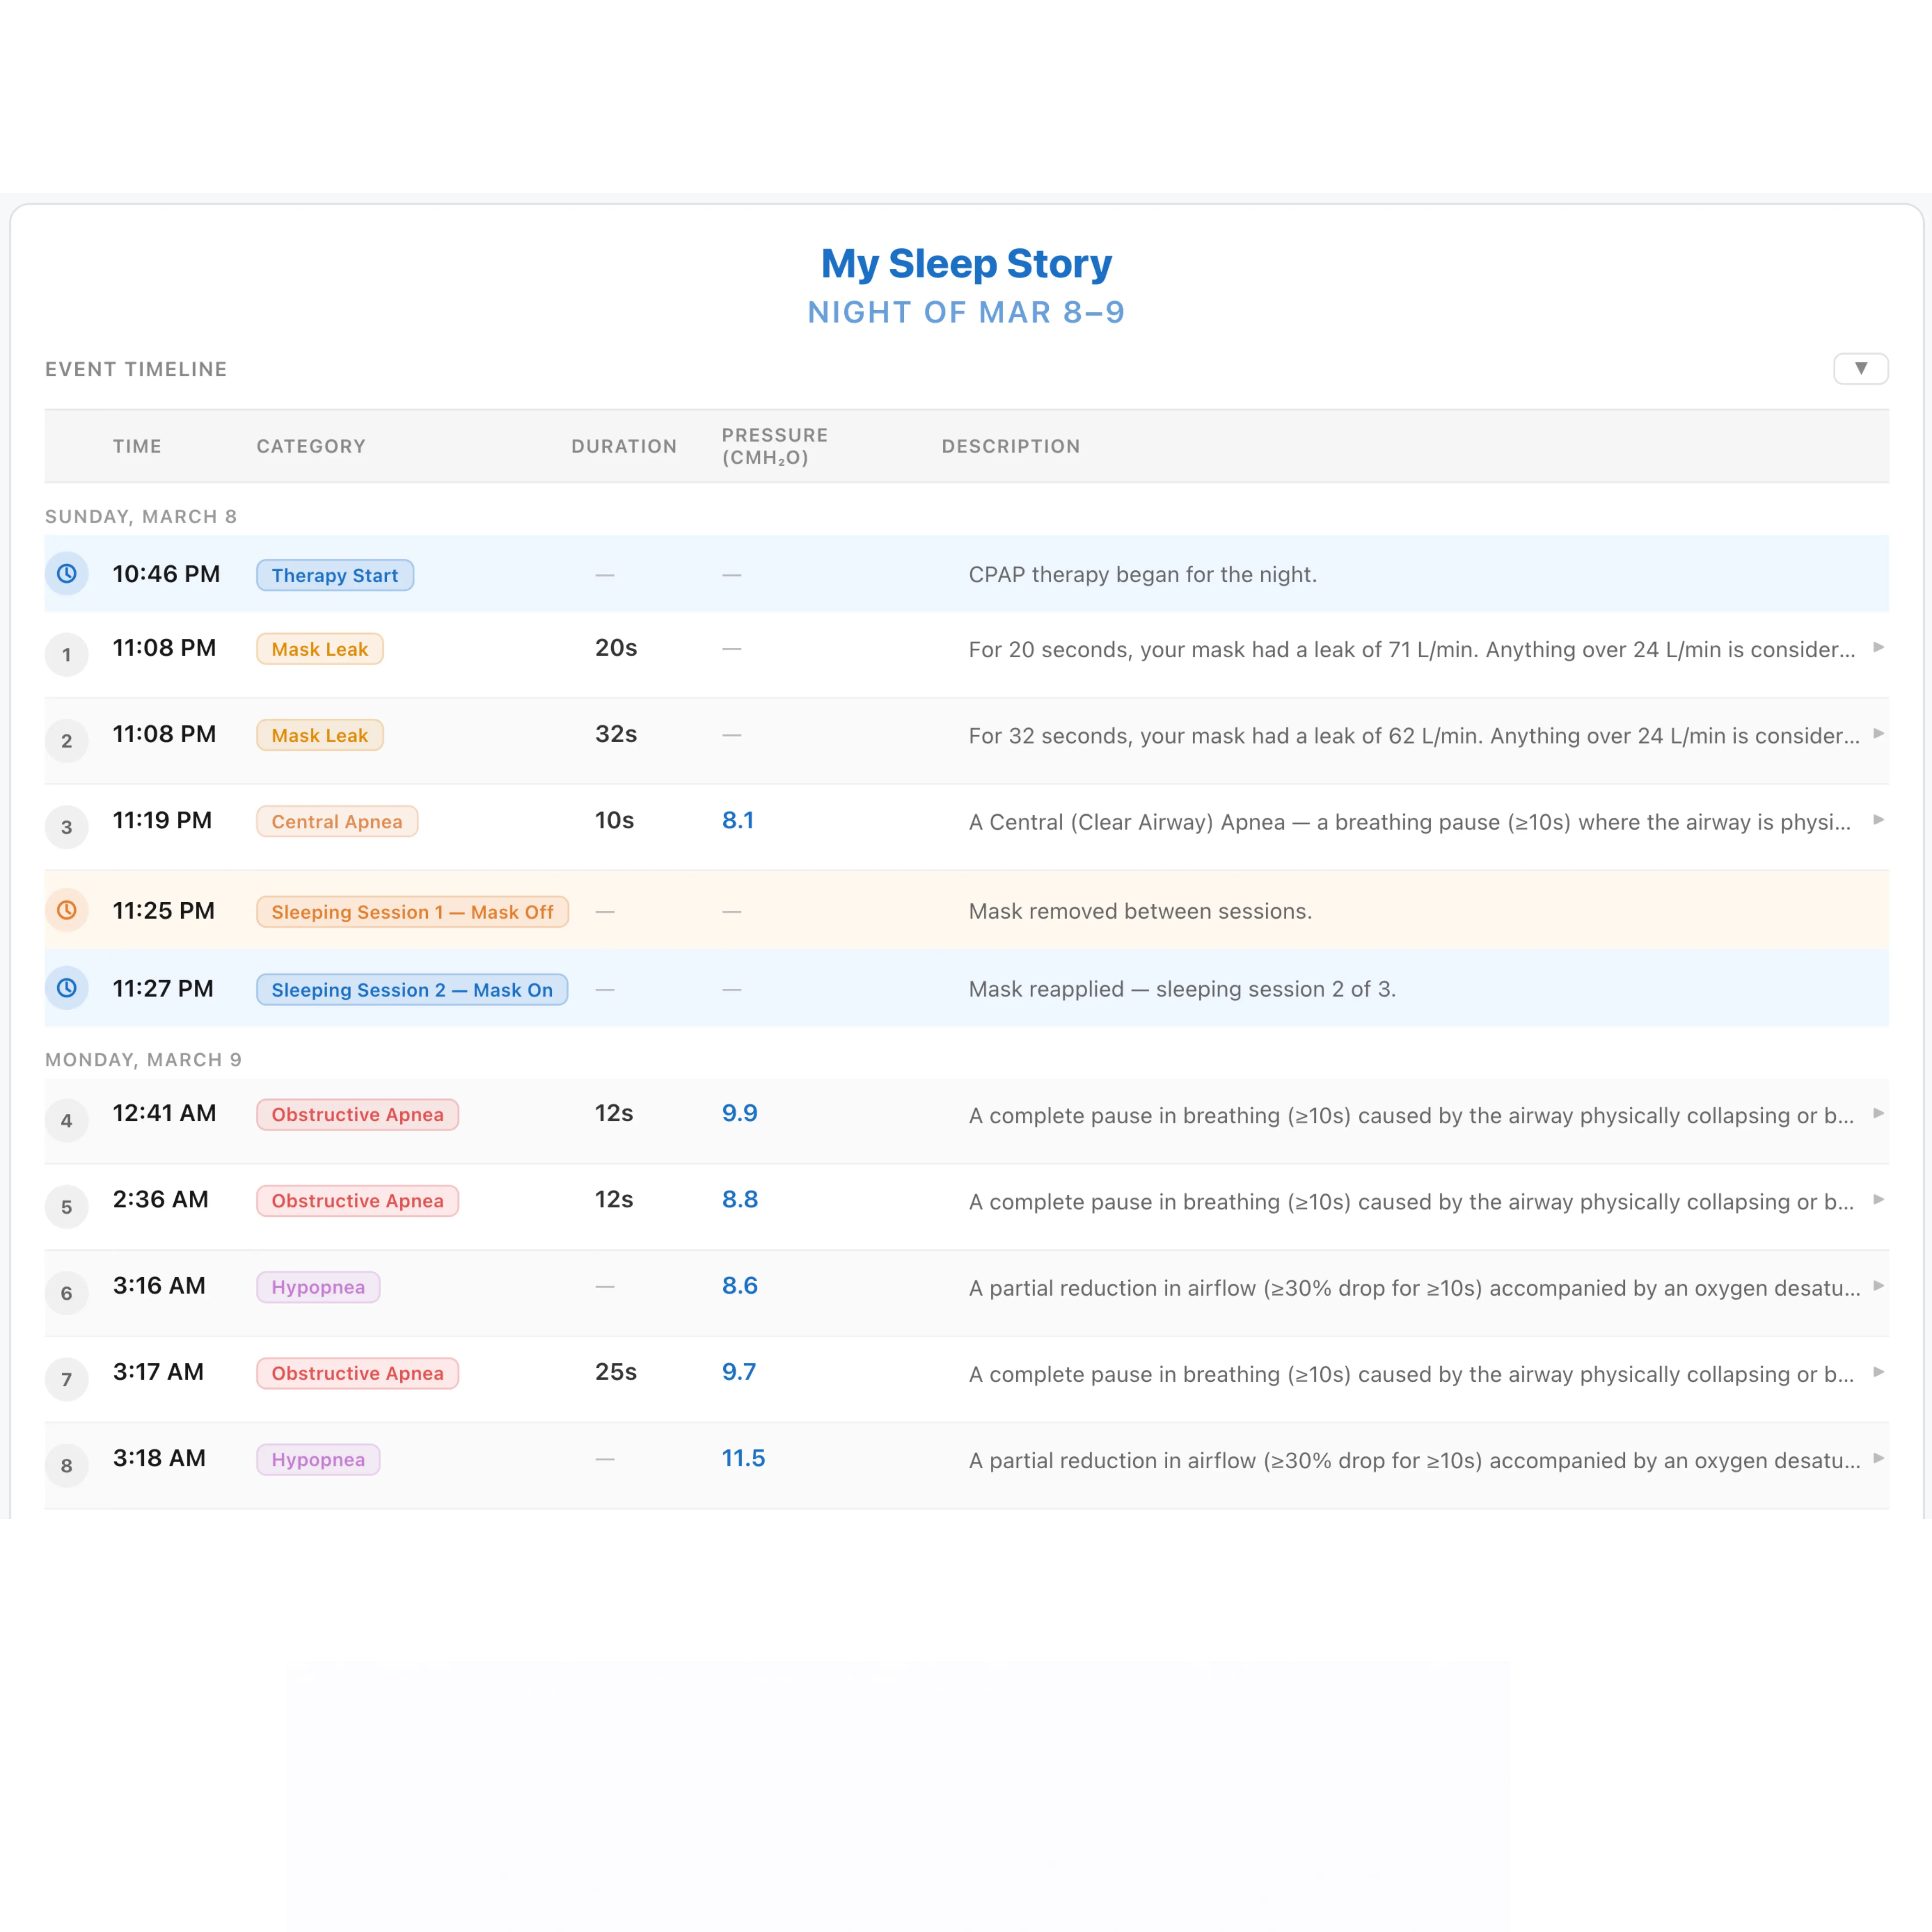
The Sleep Story view in CPAP Insights is designed for this kind of reading, showing nights in context rather than as isolated numbers. Importing your SD card regularly gives it a denser history to work with, which makes the baseline more trustworthy.
Pair AHI With the Signals Behind It
When one night looks off, AHI alone rarely explains why. Checking a few companion measures usually narrows it down quickly:
- Usage hours: was the night unusually short or interrupted by mask removal?
- Leak rate: did unintentional leak spike around the time events increased?
- Pressure: did an auto-adjusting machine climb to the top of its range?
- Flow limitation: were breaths flattened even if the AHI looks fine? This can point to subtle resistance that event counts miss.
- Event type: were the extra events obstructive, central, or hypopneas?
Using Build a Graph in CPAP Insights, you can overlay these on one timeline and see whether a cluster of events lines up with a leak burst or a pressure change. Often a bad night has a simple, visible cause, such as a mask that came loose at 3 a.m., and does not signal that therapy has stopped working.
If the same pattern keeps appearing, such as events always clustering in the last two hours of sleep, the time-of-night view can help you describe it clearly to your clinician.
When a Bad Stretch Becomes a Pattern Worth Raising
Variation is expected. A real trend looks different. Signs worth paying attention to include:
- Your 7-day average staying above your usual baseline for more than a couple of weeks.
- A shift that began right after a change in mask, pressure settings, or medications.
- Rising leak or flow limitation alongside returning symptoms like morning headaches, loud snoring reported by a partner, or daytime sleepiness.
- A growing share of central events that was not there before.
The AASM's clinical guidance on PAP therapy supports ongoing follow-up and the use of remote monitoring data alongside clinical support, because data is most useful when someone qualified interprets it with your symptoms in mind.
If your trend does shift, resist the urge to change pressure or EPR settings based on a few nights of data. Print or export the trend, note what changed, and discuss it with your sleep doctor. Sleep Doc AI in CPAP Insights can help you turn your charts into clear questions, but treatment decisions belong with your care team.